


This is a common requirement while creating dashboards. One selects an option and the charts update to show data for that particular selection. It would be very useful if the same chart could show you how that particular selection fares against average or a set benchmark.
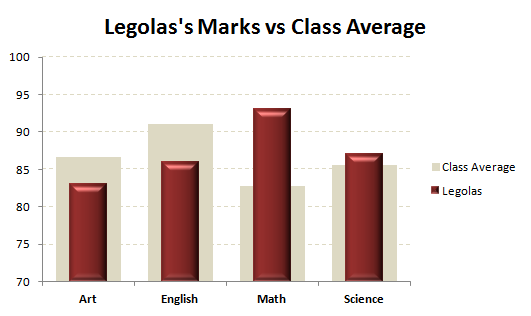
Comparison Chart Against AverageLet's take an example. I have data for a class of students with their subject marks. I make a selection of the student name, his marks for each subject are plotted on a chart. I wish to see how this particular student has performed in each subject as against the class average. This custom chart does just the same, and it can be very very easily created in Excel as below:
Step 1: Create a Clustered Column chart with both the series.
Step 2: Right-click on the series that you want to compare and plot it on the secondary axis.
Step 3: Format the 'average' data series, decrease gap width.
Step 4: Ensure that the primary and secondary axis have the same units and same minimums and maximums (as desired)
Step 5: Format the chart until you are happy with how it looks.Comparison Chart Against Average
Step 6: Your chart is ready
https://www.youtube.com/channel/UCnxwq2aGJRbjOo_MO54oaHA
https://www.youtube.com/watch?v=2oT4qrHmDMY&lc=UgyG714V_k7odQMrTz14AaABAg. 9h740K6COOA9iHOYYpaAbC
https://www.youtube.com/watch?v=2oT4qrHmDMY&lc=UgxuL6YCUckeUIh9hoh4AaABAg
https://www.youtube.com/watch?v=2oT4qrHmDMY&lc=UgwGTEyefOX7msIh1wZ4AaABAg. 9h4sd6Vs4qE9h7G-bVm8_-
https://www.youtube.com/watch?v=2oT4qrHmDMY&lc=Ugw3nF0C04AGt73H1BB4AaABAg. 9h6VhNCM-DZ9h7EqbG23kg
https://www.youtube.com/watch?v=2oT4qrHmDMY&lc=UgwGTEyefOX7msIh1wZ4AaABAg. 9h4sd6Vs4qE9h7KvJXmK8o
https://www.youtube.com/watch?v=2oT4qrHmDMY&lc=Ugw3nF0C04AGt73H1BB4AaABAg. 9h6VhNCM-DZ9h7E1gwg4Aq
https://www.youtube.com/watch?v=2oT4qrHmDMY&lc=UgywFtBEpkHDuK55r214AaABAg
https://www.youtube.com/watch?v=2oT4qrHmDMY&lc=UgwviLabd7r_3KpP6wh4AaABAg. 9h5lFRmix1R9h79hNGvJbu
https://www.youtube.com/watch?v=2oT4qrHmDMY&lc=UgwviLabd7r_3KpP6wh4AaABAg. 9h5lFRmix1R9h79YAfa24T
https://www.youtube.com/watch?v=2oT4qrHmDMY&lc=UgwviLabd7r_3KpP6wh4AaABAg. 9h5lFRmix1R9h79M1SYH1E
https://www.youtube.com/watch?v=2oT4qrHmDMY&lc=UgwviLabd7r_3KpP6wh4AaABAg. 9h5lFRmix1R9h78SxhXTnR
https://www.youtube.com/channel/UCnxwq2aGJRbjOo_MO54oaHA


 Reply With Quote
Bookmarks