


here is table from csv (100 rows)
with CF defined for each filter (hardcoded) then table filtered by No Color
The trick is that the filter should not be hardcoded
with rows counted manually


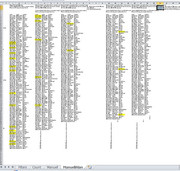
here is table from csv (100 rows)
with CF defined for each filter (hardcoded) then table filtered by No Color
The trick is that the filter should not be hardcoded
with rows counted manually
Last edited by sandy666; 08-25-2023 at 05:05 AM.
sandy
I know you know but I forgot my Crystal Ball and don't know what you know also I may not remember what I did weeks, months or years ago so answer asap. Thinking doesn't hurt


I don’t know anything about CF or Filters in Excel, so I don’t know what to do with any of that.Originally Posted by sandy666

Never mind
That table looks the same as the Tables and the csv text files we have used so far.
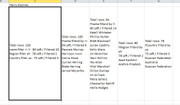
In that last file I added another worksheet, ManuellAlan copied the data range, and then did it all manually
, no VBA
, no PQ
, no CF, filter or anything
, just Alan and his hands very big brain.
Results from me doing it with just my brain and hands:
_____ Workbook: test01.xlsx ( Using Excel 2010 32 bit )
Worksheet: ManuellAlan
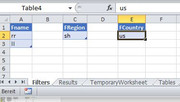
Row\Col Filter name by ll and rr takes out 20 rows, so left with 80 Then filter region by sh takes out 2 rows, so 78 left Then filter country by us takes out 3 rows, so I am left wir 75
Results from my VBA coding
For this filter set:
, I still get the same results as before:
, and they are the same as when I did it all manually.
So, so far I think my VBA coding is giving the correct results.
Last edited by DocAElstein; 08-25-2023 at 12:01 PM.
 Posting Permissions


 Reply With Quote
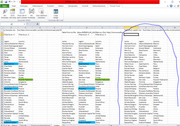
Bookmarks